grid_zoom
grid_zoom.RdThis function takes a grob object (e.g. created with package grid) and adds a zoom window.
grid_zoom(inputGrob = pointsGrob(runif(200),runif(200)),
          inputViewport = viewport(name='main'),
          x = 'topleft', y, just,
          ratio = c(.3,.4), zoom_xlim, zoom_ylim,
          rect = TRUE, rect_lwd = 1, rect_fill = 'gray92',
          draw =TRUE, zoom_fill = 'white',
          zoom_frame_gp = gpar(lwd = 1),
          zoom_gp = NULL, zoom_xaxis = xaxisGrob(main = FALSE),
          zoom_yaxis = NULL)
Arguments
- inputGrob
A grob object, e.g created with package grid.
- inputViewport
Viewport related to
inputGrob.- x
Specifies the
xcoordinate of the zoom window. Alternatively it can be set to 'topleft', 'topright', 'bootmleft' or 'bootmright'- y
Specifies the
ycoordinate of the zoom window.- just
Specifies the justification of the zoom window.
- ratio
Specifies size of the zoom window relative to the main window.
- zoom_xlim
Specifies xlim value of the zoom window.
- zoom_ylim
Specifies ylim value of the zoom window.
- rect
Logical, if TRUE a rectangle of the zoom region is draw in the main window.
- rect_lwd
lwd of the rectangle.
- rect_fill
fill of the rectangle.
- draw
logical, if TRUE the returned grob object is also drawn.
- zoom_fill
fill color of the zoom window.
- zoom_frame_gp
gpar() of the frame of the zoom window.
- zoom_gp
gpar() of the inputGrob in the zoom viewport.
- zoom_xaxis
xaxisGrob() to draw for the zoom window.
- zoom_yaxis
yaxisGrob() to draw for the zoom window.
Value
A grob object.
Details
A zoom plot does only make sense if all objects of the inputGrob
are specified in native units. Additional caution me be require
for certain grobs: e.g. a zoom of a circleGrob() is problematic if the x
and y axis are stretched by a different amount.
See also
grid_trace2
Examples
require(grid)
#> Loading required package: grid
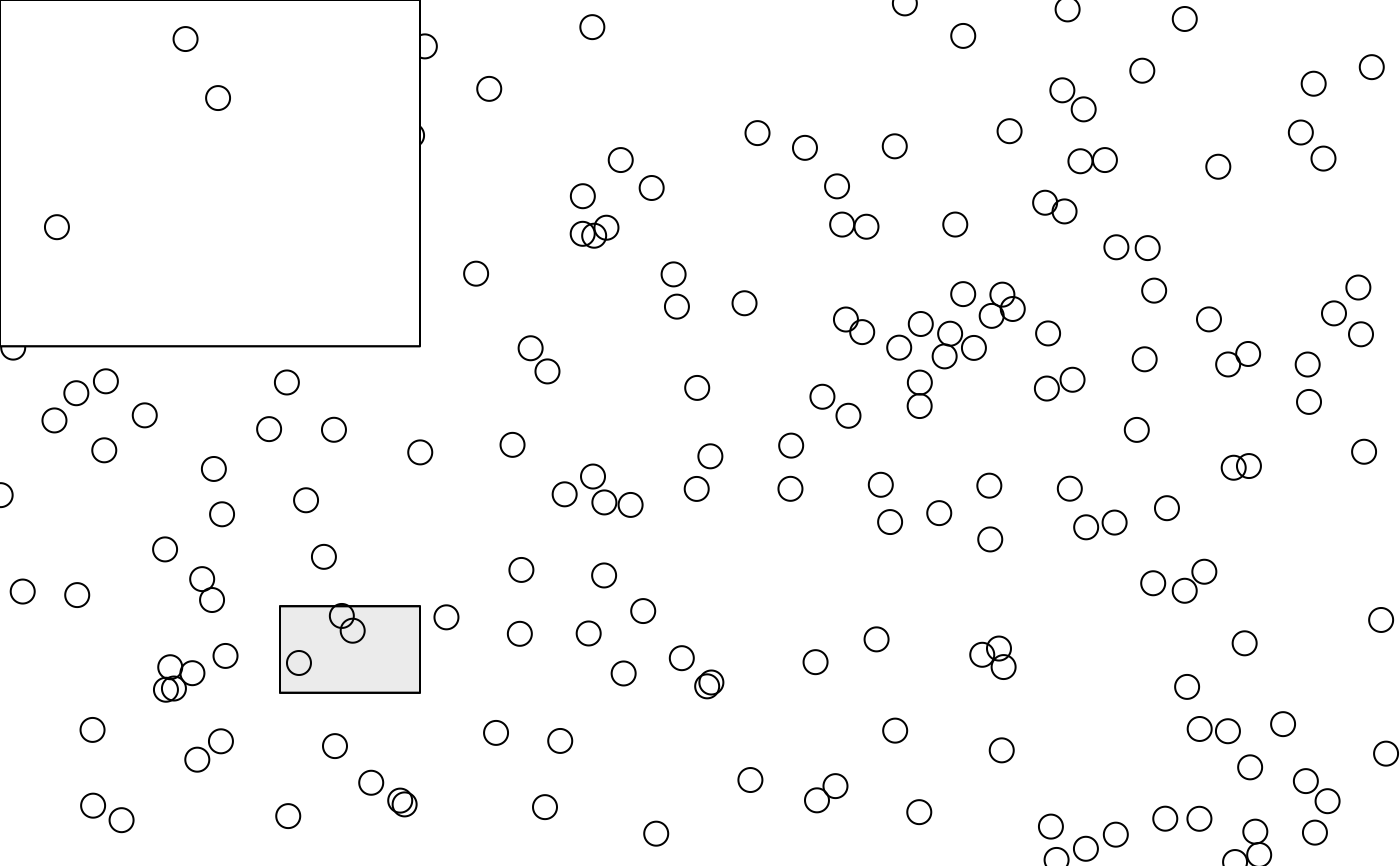
## -- Example 1 --
set.seed(133)
grid_zoom(inputGrob = pointsGrob(runif(200), runif(200)),
inputViewport = viewport(name = 'main'),
zoom_xlim = c(.2, .3), zoom_ylim = c(.2, .3))
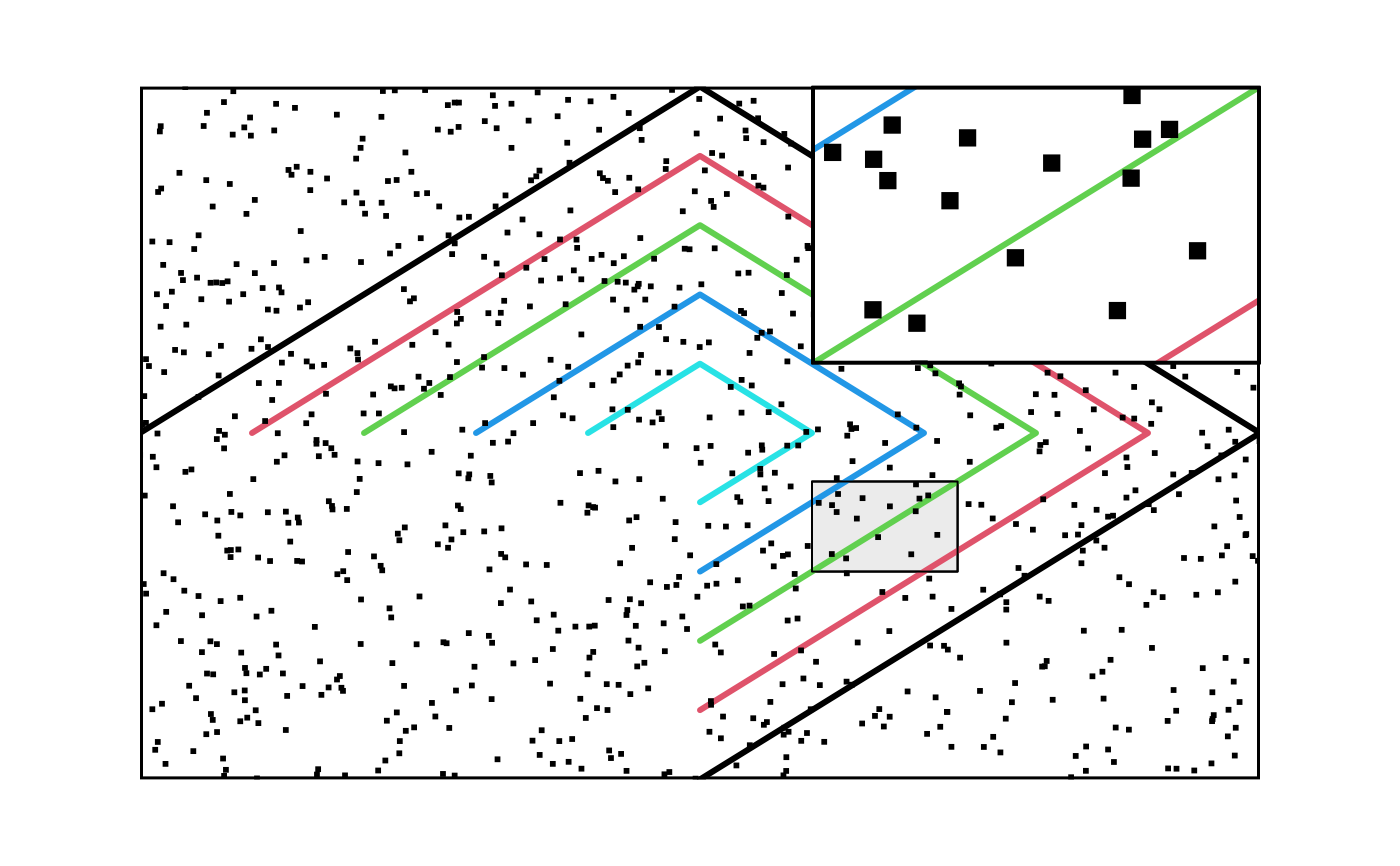
 ## -- Example 2 --
## initial plot
grid.newpage()
vp <- viewport(width=.8, height=.8, clip='on')
gt <- gTree(children=gList(polylineGrob(x=c((0:4)/10, rep(.5, 5), (10:6)/10, rep(.5, 5)),
y=c(rep(.5, 5), (10:6/10), rep(.5, 5), (0:4)/10),
id=rep(1:5, 4), default.units='native',
gp=gpar(col=1:5, lwd=3)),
pointsGrob(runif(1000), runif(1000),pch='.', gp=gpar(cex=3)),
rectGrob(gp=gpar(lwd=3))))
pushViewport(vp)
grid.draw(gt)
## -- Example 2 --
## initial plot
grid.newpage()
vp <- viewport(width=.8, height=.8, clip='on')
gt <- gTree(children=gList(polylineGrob(x=c((0:4)/10, rep(.5, 5), (10:6)/10, rep(.5, 5)),
y=c(rep(.5, 5), (10:6/10), rep(.5, 5), (0:4)/10),
id=rep(1:5, 4), default.units='native',
gp=gpar(col=1:5, lwd=3)),
pointsGrob(runif(1000), runif(1000),pch='.', gp=gpar(cex=3)),
rectGrob(gp=gpar(lwd=3))))
pushViewport(vp)
grid.draw(gt)
 ## plot with zoom window
grid.newpage()
grid_zoom(inputGrob = gt,
inputViewport = vp,
x='topright', zoom_xlim=c(.6,.73), zoom_ylim=c(.3,.43),ratio=.4,
zoom_xaxis = NULL, zoom_gp = gpar(cex=3))
## plot with zoom window
grid.newpage()
grid_zoom(inputGrob = gt,
inputViewport = vp,
x='topright', zoom_xlim=c(.6,.73), zoom_ylim=c(.3,.43),ratio=.4,
zoom_xaxis = NULL, zoom_gp = gpar(cex=3))