Exploratory data analysis for a three-class ROC marker
roc.eda.RdA function that investigates data that arose from a single marker and containes the reference standard of the three classes "healthy", "intermediate" and "diseased".
Arguments
- x, y, z
numeric vectors contaning the measurements from the healthy, intermediate and diseased class.
- dat
a data frame of the following structure: The first column represents a factor with three levels, containing the true class membership of each measurement. The levels are ordered according to the convention of higher values for more severe disease status.
- type
a character, specifying if the
empiricalVUS and tests or thetrinormalVUS and tests are computed.- plotVUS
a logical whether to evaluate and plot the VUS (default is
FALSE). Note: To save a pngplotVUSneeds to beTRUEtoo.- saveVUS
a logical whether to save a PNG of the VUS in your current working directory (default is
FALSE).- sep.dens
a logical indicating if the densitie plots should be plotted on separate x-axes (
TRUE) or on a common axe (FALSE, is default).- scatter
a logical indicating if the measurements per class plot should be plotted as a boxplot (default) or as a scatterplot (
scatter = TRUE).- conf.level
A numeric value between 0 and 1 yielding the significance level \(\alpha=1-\code{conf.level}\).
- n.boot
an integer incicating the number of bootstrap replicates sampled to obtain the variance of the VUS. Default is 1000.
- verbose
a logical, indicating whether output should be displayed or not. Default is
TRUE.- alternative
a character string specifying the alternative hypothesis, must be one of
"two.sided"(default),"greater"or"less".
Value
A list with class "htest" containing the following components:
- statistic
The value of the test(s).
- p.value
The p-value for the test(s).
- VUS
the VUS computed with the specific method defined in
type.- dat.summary
A data frame displaying size, mean and standard deviation of the three classes.
- alternative
The alternative hypothesis.
- type
a character containing the the method used for the exploratory data analysis.
- data.name
a character containing the name of the data.
- xVUS, yVUS, zVUS
(if
plotVUS = TRUE) numeric vectors and matrices computed byrocsurf.emporrocsurf.trin, used for displaying the surface with packagergl.- histROC
a
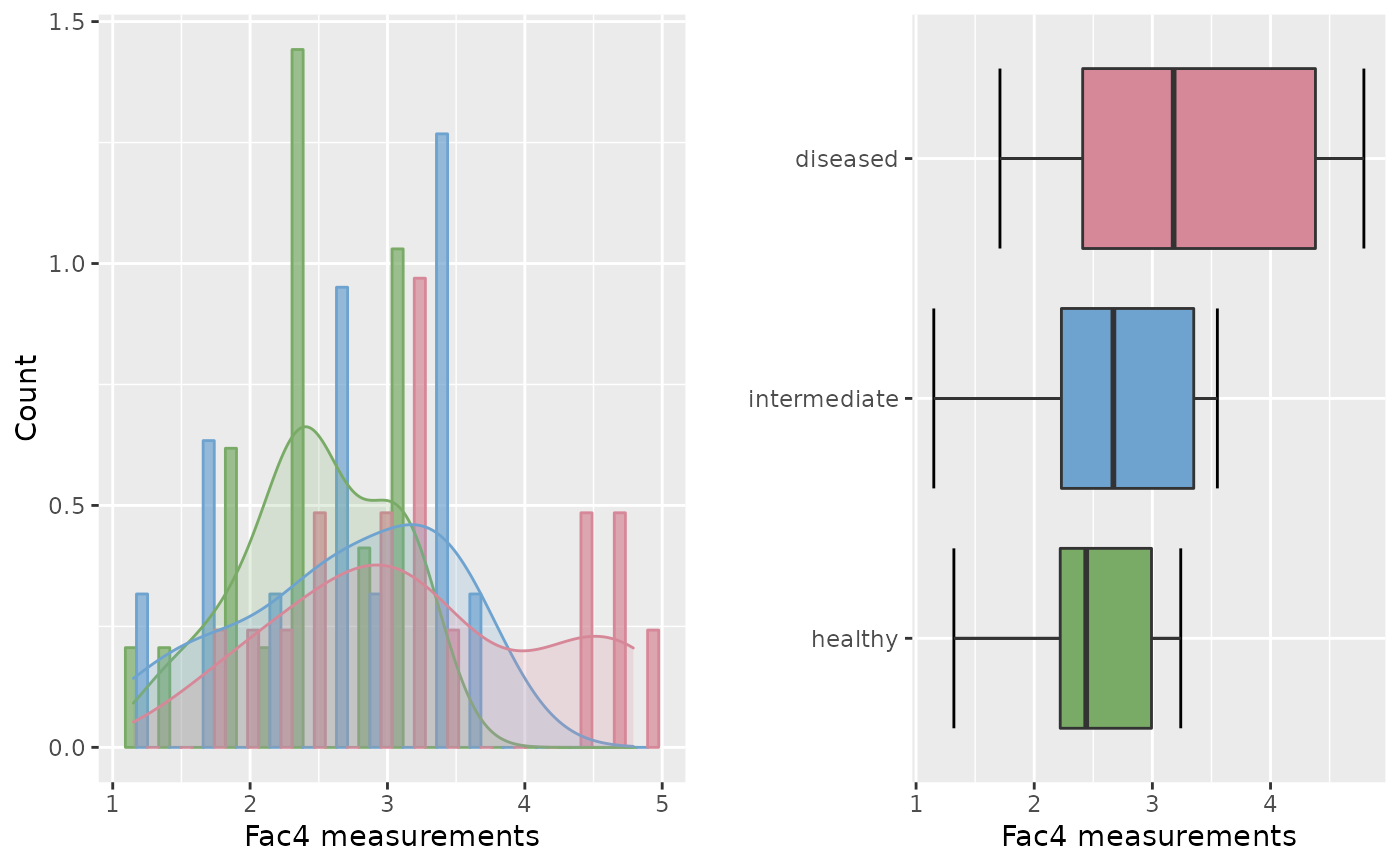
ggplot2object, displaying the historgrams and densities of the three classes.- meas.overview
A ggplot2 object, displaying the boxplots (if
scatter = FALSE) or scatter plots of the three classes (ifscatter = TRUE).
Details
For the preliminary assessment of a classifier, exporatory data analysis (EDA) on the markers is necessary. This function assesses measurements from a single marker and computes the VUS, statistical tests and returns a summary table as well as some plots of the data.
Warning
If type = "empirical", computation may take a while, as roc.eda calls
the function boot.test().
See also
trinROC.test, trinVUS.test for trinormal
data investigation, boot.test for empirical data analysis.
rocsurf.emp, rocsurf.trin for the surface plot.
Examples
data(krebs)
# empirical EDA:
roc.eda(dat = krebs[,c(1,5)], type = "e", plotVUS = FALSE)
 #>
#> Data overview of empirical ROC Classifier
#> ---------------------------------------------------------------------
#>
#> Applied test: Bootstrap test
#> Significance level: 0.05
#> Alternative hypothesis: two.sided
#> ---------------------------------------------------------------------
#> data: healthy, intermediate and diseased
#>
#> Boot statistic: 1.501, Boot p.value: 0.13326
#>
#> empirical VUS: 0.283
#> ---------------------------------------------------------------------
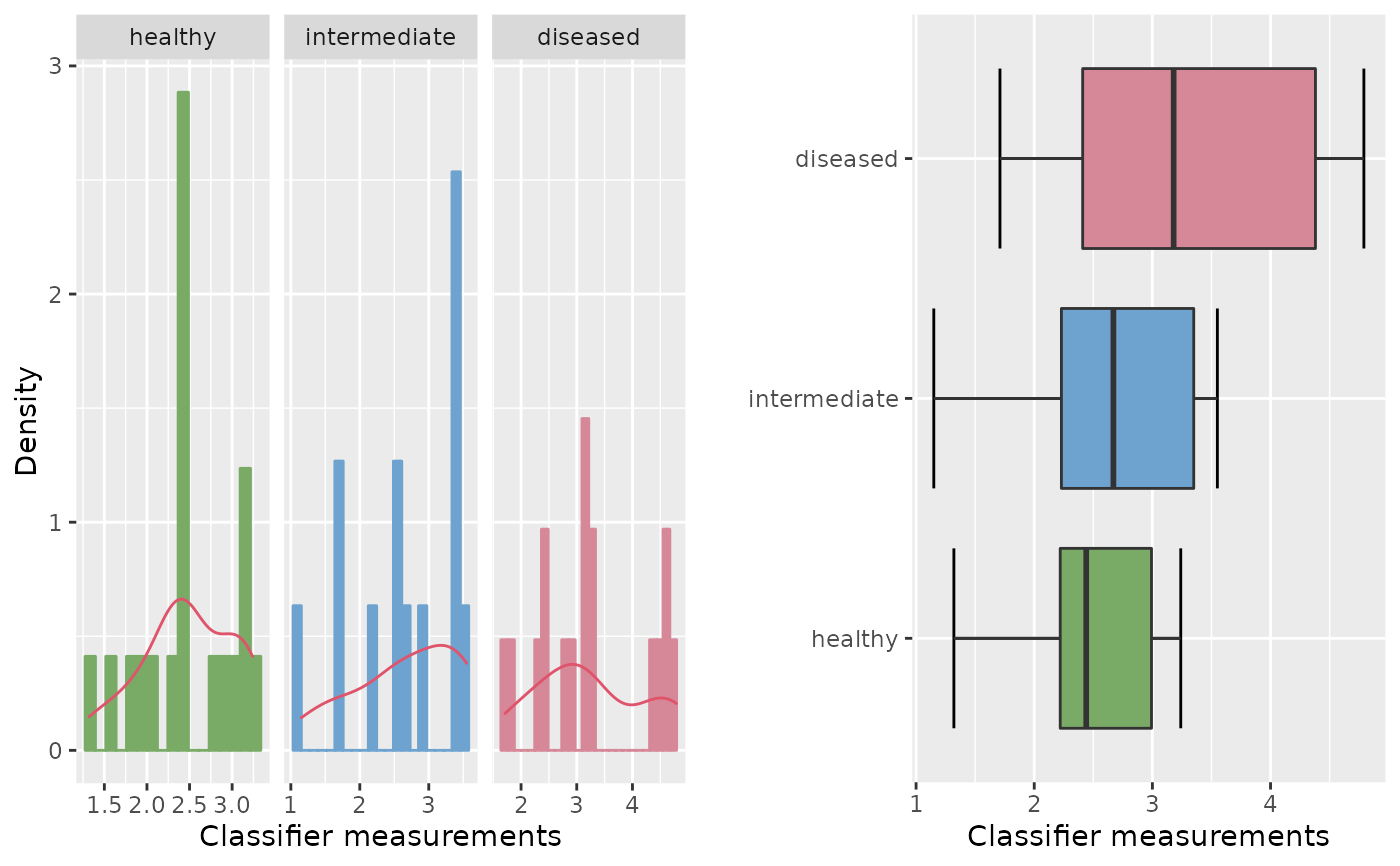
# equal data input via:
x <- with(krebs, krebs[trueClass=="healthy", 5])
y <- with(krebs, krebs[trueClass=="intermediate", 5])
z <- with(krebs, krebs[trueClass=="diseased", 5])
roc.eda(x, y, z, type = "e", sep.dens = TRUE)
#>
#> Data overview of empirical ROC Classifier
#> ---------------------------------------------------------------------
#>
#> Applied test: Bootstrap test
#> Significance level: 0.05
#> Alternative hypothesis: two.sided
#> ---------------------------------------------------------------------
#> data: healthy, intermediate and diseased
#>
#> Boot statistic: 1.501, Boot p.value: 0.13326
#>
#> empirical VUS: 0.283
#> ---------------------------------------------------------------------
# equal data input via:
x <- with(krebs, krebs[trueClass=="healthy", 5])
y <- with(krebs, krebs[trueClass=="intermediate", 5])
z <- with(krebs, krebs[trueClass=="diseased", 5])
roc.eda(x, y, z, type = "e", sep.dens = TRUE)
 #>
#> Data overview of empirical ROC Classifier
#> ---------------------------------------------------------------------
#>
#> Applied test: Bootstrap test
#> Significance level: 0.05
#> Alternative hypothesis: two.sided
#> ---------------------------------------------------------------------
#> data: x, y and z
#>
#> Boot statistic: 1.501, Boot p.value: 0.13326
#>
#> empirical VUS: 0.283
#> ---------------------------------------------------------------------
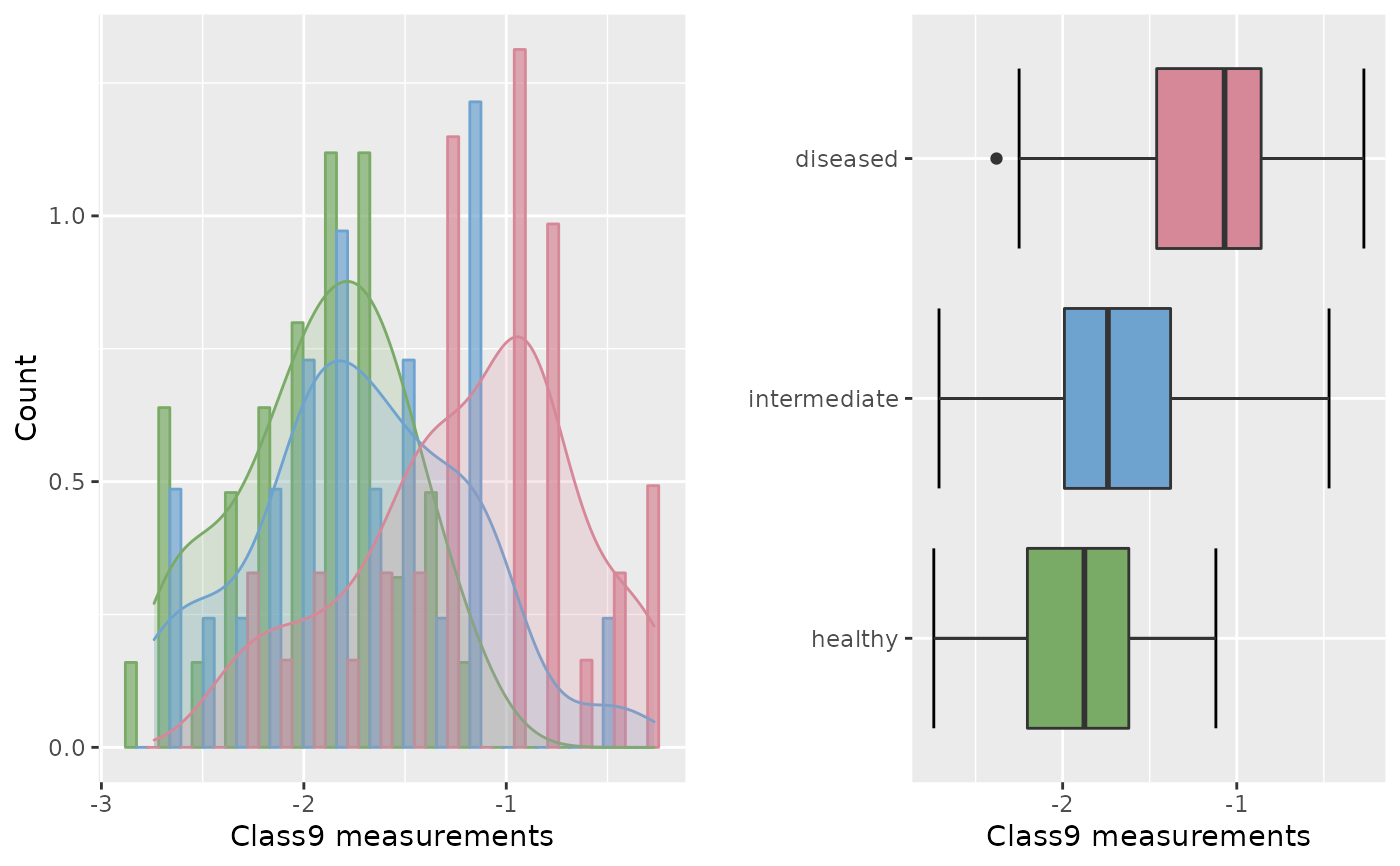
data(cancer)
# trinormal EDA:
roc.eda(dat = cancer[,c(1,10)], type = "trin", plotVUS = FALSE)
#>
#> Data overview of empirical ROC Classifier
#> ---------------------------------------------------------------------
#>
#> Applied test: Bootstrap test
#> Significance level: 0.05
#> Alternative hypothesis: two.sided
#> ---------------------------------------------------------------------
#> data: x, y and z
#>
#> Boot statistic: 1.501, Boot p.value: 0.13326
#>
#> empirical VUS: 0.283
#> ---------------------------------------------------------------------
data(cancer)
# trinormal EDA:
roc.eda(dat = cancer[,c(1,10)], type = "trin", plotVUS = FALSE)
 #>
#> Data overview of trinormal ROC Classifier
#> ---------------------------------------------------------------------
#>
#> Applied tests: Trinormal based ROC and VUS test
#> Significance level: 0.05
#> Alternative hypothesis: two.sided
#> ---------------------------------------------------------------------
#> data: healthy, intermediate and diseased
#>
#> ROC test statistic: 40.56, ROC p.value: 0
#> VUS test statistic: 4.373 , VUS p.value: 1e-05
#>
#> trinormal VUS: 0.406
#>
#> Parameters:
#> a b c d
#> 1.2756 -0.4844 0.9887 0.9889
#> ---------------------------------------------------------------------
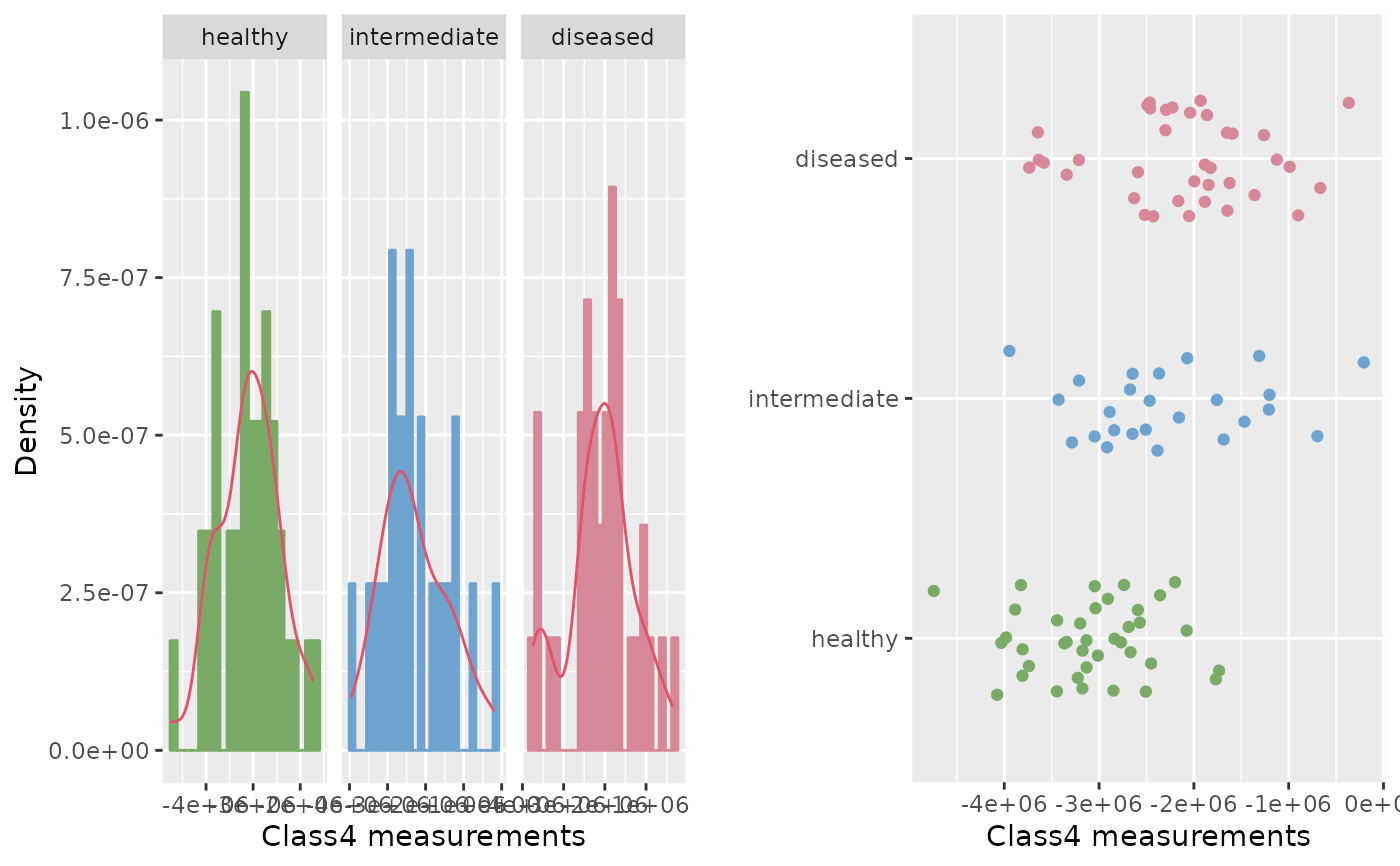
# trinormal EDA with different plots:
roc.eda(dat = cancer[,c(1,5)], type = "t", sep.dens = TRUE, scatter = TRUE)
#>
#> Data overview of trinormal ROC Classifier
#> ---------------------------------------------------------------------
#>
#> Applied tests: Trinormal based ROC and VUS test
#> Significance level: 0.05
#> Alternative hypothesis: two.sided
#> ---------------------------------------------------------------------
#> data: healthy, intermediate and diseased
#>
#> ROC test statistic: 40.56, ROC p.value: 0
#> VUS test statistic: 4.373 , VUS p.value: 1e-05
#>
#> trinormal VUS: 0.406
#>
#> Parameters:
#> a b c d
#> 1.2756 -0.4844 0.9887 0.9889
#> ---------------------------------------------------------------------
# trinormal EDA with different plots:
roc.eda(dat = cancer[,c(1,5)], type = "t", sep.dens = TRUE, scatter = TRUE)
 #>
#> Data overview of trinormal ROC Classifier
#> ---------------------------------------------------------------------
#>
#> Applied tests: Trinormal based ROC and VUS test
#> Significance level: 0.05
#> Alternative hypothesis: two.sided
#> ---------------------------------------------------------------------
#> data: healthy, intermediate and diseased
#>
#> ROC test statistic: 27.129, ROC p.value: 2e-05
#> VUS test statistic: 3.6 , VUS p.value: 0.00032
#>
#> trinormal VUS: 0.356
#>
#> Parameters:
#> a b c d
#> 1.3477 -1.229 1.0791 0.2033
#> ---------------------------------------------------------------------
#>
#> Data overview of trinormal ROC Classifier
#> ---------------------------------------------------------------------
#>
#> Applied tests: Trinormal based ROC and VUS test
#> Significance level: 0.05
#> Alternative hypothesis: two.sided
#> ---------------------------------------------------------------------
#> data: healthy, intermediate and diseased
#>
#> ROC test statistic: 27.129, ROC p.value: 2e-05
#> VUS test statistic: 3.6 , VUS p.value: 0.00032
#>
#> trinormal VUS: 0.356
#>
#> Parameters:
#> a b c d
#> 1.3477 -1.229 1.0791 0.2033
#> ---------------------------------------------------------------------