Plot faecal egg count data
plotCounts.RdPlot egg count data to reflect changes between before and after treatment.
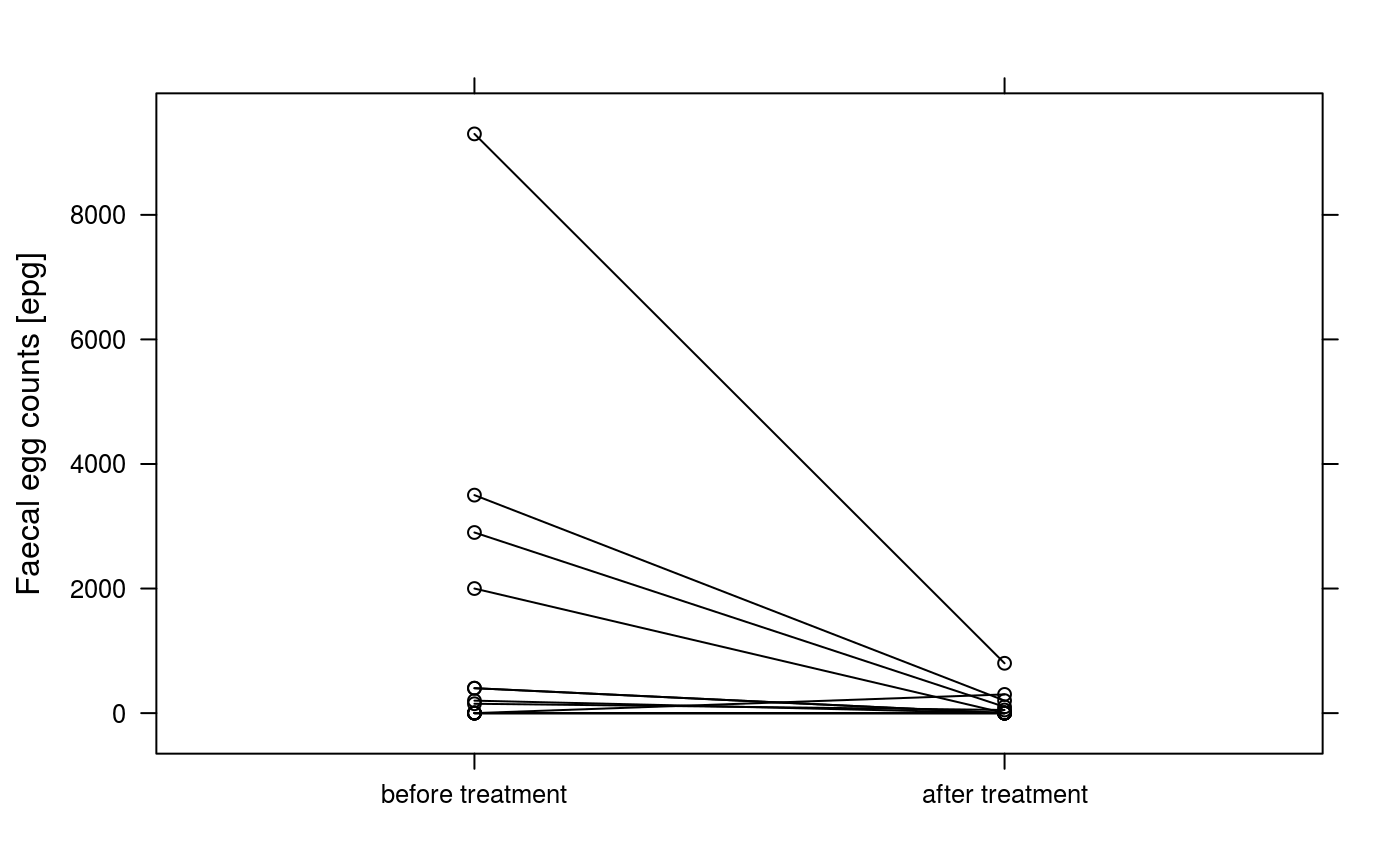
plotCounts(data, paired = TRUE, points = TRUE,
    points.method = "jitter",  xlabel = "",
    ylabel = "Faecal egg counts [epg]", ...)
Arguments
| data | a data.frame with two columns, the first column is before treatment counts, the second column is after treatment counts. |
|---|---|
| paired | logical. If TRUE, uses the plot for the paired design. Otherwise uses the plot for the unpaired design. |
| points | logical. If TRUE, add individual points for unpaired plot. Not used if |
| points.method | string. It is used to separate coincident points if |
| xlabel | string. Label of x-axis. |
| ylabel | String. Label of y-axis. |
| ... | Additional arguments for function |
Value
A plot is drawn.
Details
For paired data, a xyplot is used. For unpiared data, a grouped boxplot is used.